Category
Analysis
Description
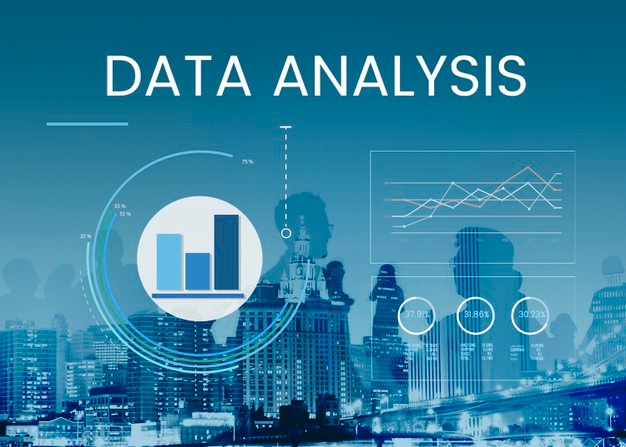
In order to find relevant information, support inferences, and help decision-making, data analysis is the process of analyzing, cleaning, manipulating, and modeling data. Data analysis is utilized in several fields of business, science, and social science and has many dimensions and methodologies. It includes various techniques and goes by many different names. Data analysis contributes to more scientific decision-making and more efficient business operations in the modern business world.
What you'll learn
Learn about basic formatting in excel.
Learn about sorting and filtering functions in excel.
Learn about UPPER, LOWER, PROPER, LEFT, RIGHT, SEARCH, CONCATENATE functions in excel.
Learn how to find outliers and missing values in Excel.
Learn how to find standard deviation and percentiles in data using Excel.
Learn about using Color Bars and Color scales in excel
Learn how to merge datasets using Index and match.
Learn making interactive dashboards in excel.
Learn how to perform linear regression in excel.
Learn about different DDL and DML commands.
Learn about sorting and filtering functions in excel.
Learn how to find outliers and missing values in Excel.
Learn about IF, IF ERROR, COUNTIF, SUMIF and AVERAGEIF functions in excel.
Learn applying VLOOKUP and HLOOKUP functions and merge datasets using them in excel.
Learn making Pivot Tables and Pivot charts in excel.
Learn about What-if analysis in excel.